Market Outlook
March 08, 2017
Market Cues
Domestic Indices
Chg (%)
(Pts)
(Close)
Indian markets are likely to open flat with a negative bias tracking subdued overseas
BSE Sensex
(0.2)
(49)
29,000
market and SGX Nifty.
Nifty
(0.2)
(17)
8,947
The US markets remained lackluster during the day and traded in narrow range for
Mid Cap
0.1
19
13,504
most of the day. Finally ending mildly lower. While at higher levels there could be
Small Cap
0.0
4
13,675
profit taking, concerns over increase in interest rates at next weeks Federal Reserve’s
meeting also weighed on the markets. The Labor department job data to be
Bankex
(0.2)
(49)
23,532
released this Friday could set the next direction for the markets.
European markets also remained lackluster on Tuesday as French political worries
Global Indices
Chg (%)
(Pts)
(Close)
persisted, earnings updates from a series companies came out mixed and economic
Dow Jones
(0.1)
(30)
20,925
data Germany Factory orders and U.K house prices disappointed investors.
Nasdaq
(0.3)
(15)
5,834
Indian markets remained in narrow range during Tuesday and closed on a
FTSE
(0.2)
(11)
7,339
marginally negative note. Metals and Auto stocks witnessed some profit booking.
Nikkei
(0.2)
(35)
19,344
However, ahead of UP election results the markets may not see major move in either
Hang Seng
0.4
85
23,681
direction in a day or two.
Shanghai Com
0.3
9
3,242
News Analysis
Tech Mahindra acquires CJS Solutions in US
Advances / Declines
BSE
NSE
Detailed analysis on Pg2
Advances
1,161
672
Declines
1,700
964
Investor’s Ready Reckoner
Unchanged
166
90
Key Domestic & Global Indicators
Stock Watch: Latest investment recommendations on 150+ stocks
Volumes (` Cr)
Refer Pg5 onwards
BSE
2,933
Top Picks
NSE
19,729
CMP
Target
Upside
Company
Sector
Rating
(`)
(`)
(%)
Net Inflows (` Cr)
Net
Mtd
Ytd
Amara Raja Batteries Auto & Auto Ancillary
Buy
842
1,009
19.8
HCL Tech
IT
Buy
856
1,000
16.8
FII
920
2939
8704
Power Grid Corp.
Power
Buy
195
223
14.6
MFs
(1074)
(2122)
935
Navkar Corp.
Others
Buy
165
265
60.6
KEI Industries
Others
Buy
168
207
23.2
Top Gainers
Price (`)
Chg (%)
More Top Picks on Pg3
Deltacorp
171
11.0
Justdial
587
7.0
Key Upcoming Events
Previous
Consensus
Adanipower
40
4.8
Date
Region
Event Description
Reading
Expectations
Kscl
522
4.6
Mar 08 China
Exports YoY%
7.90
14.00
Mindtree
479
4.0
Mar 09 China
Consumer Price Index (YoY)
2.50
1.70
Mar 09 US
Initial Jobless claims
223.00
238.00
Mar 09 Euro Zone ECB announces interest rates
0.00
0.00
Top Losers
Price (`)
Chg (%)
Mar 10 UK
Industrial Production (YoY)
4.30
3.20
Rcom
36
(3.6)
More Events on Pg4
Hindalco
193
(3.5)
Hindzinc
299
(3.4)
Jktyre
120
(3.2)
Sail
60
(2.9)
As on March 07, 2017
Market Outlook
March 08, 2017
News Analysis
Tech Mahindra acquires CJS Solutions in US
Tech Mahindra Ltd has signed a definitive agreement to acquire CJS Solutions
Group LLC, a US-based healthcare information technology consulting company
that does business as The HCI Group. The deal values CJS Solutions at an
enterprise value of US$110mn.Tech Mahindra will make an upfront payment of
US$89.5mn for purchase of an 84.7% stake in the firm. The balance stake of
15.3% will be acquired over a period of three years. The HCI Group works with
global tier-I healthcare service providers, primarily in the US and UK. It focuses on
providing end-to-end implementation of electronic health record (EHR) and
electronic medical record (EMR) software, training and support services. The
company also has a presence in Europe, West Asia and Asia-Pacific, and employs
more than 500 professionals globally.
In the 12-month period to September 2016, The HCI Group had revenues of
US$114mn. The transaction is expected to close by April, subject to regulatory
approvals. Lodestone Corporate Advisors is the exclusive adviser to Tech Mahindra
on the transaction. The margins of CJS are in high single digit, thus will be margin
accretive for the company. The CJS transaction is expected to close by April 2017.
The acquisition will be mostly funded through internal accruals.
While the acquisition is small one, it will enable the company in diversify its
revenue stream. On valuations it’s difficult to comment as the ROE of the acquired
firm is not know, though it will not add anything substantial on the net profit front,
given the low margins of the acquired business and hence we maintain our buy
with a price target of `600.
Economic and Political News
Eight highways in Gujrata to be upgraded at `12,000cr, says the Govt
US trade deficit jumps to 5 year high on imports
IT notices to 4000 firms over unusual cash deposits
Not ban might affect some sectors in Q4, says RBI
Go-Air revives IPO plan as aviation stock soars
Corporate News
Maruti Suzuki unveils 3rd generation Swift at Geneva motor show
Tata Motors unveils sports car RACEMO, market launch likely in FY18.
Nestle India aims to go beyond foods
Tata Motors and Volkswagen in partnership talks.
D-Link India has tied up with Reliance-Jio to launch fixed line digital services.
Market Outlook
March 08, 2017
Top Picks ★★★★★
Large Cap
Market Cap
CMP
Target
Upside
Company
Rationale
(` Cr)
(`)
(`)
(%)
To outpace battery industry growth due to better technological
Amara Raja Batteries
14,386
842
1,009
19.8
products leading to market share gains in both the
automotive OEM and replacement segments.
Strong growth in domestic business due to its leadership in
Alkem Laboratories
24,494
2,049
2,257
10.2
acute therapeutic segment. Alkem expects to launch more
products in USA, which bodes for its international business.
The stock is trading at attractive valuations and is factoring all
HCL Tech
1,20,772
856
1,000
16.8
the bad news.
Back on the growth trend, expect a long term growth of 14%
Infosys
2,34,219
1,020
1,249
22.5
to be a US$20bn in FY2020.
Strong order backlog and improvement in execution would
Larsen & Toubro
1,38,513
1,485
1,634
10.1
trigger the growth for the L&T
One of the largest pharma companies with strong
Lupin
65,720
1,456
1,809
24.3
international presence. It has a rich pipeline of ANDAs which
is also one of the largest among the generic companies.
Going forward, we expect the company to report strong top-
Power Grid Corporation
1,01,781
195
223
14.6
line CAGR of ~16% and bottom-line CAGR of ~19% over
FY16-18 on back of strong capitalization guidance
Source: Company, Angel Research
Mid Cap
Market Cap
CMP
Target
Upside
Company
Rationale
(` Cr)
(`)
(`)
(%)
We expect the company would report strong profitability
Asian Granito
863
287
351
22.4
owing to better product mix, higher B2C sales and
amalgamation synergy.
Among the top 4 players in the consumer durables segment.
Bajaj Electricals
2,768
273
295
7.9
Improved profitability backed by turn around in E&P segment.
Strong order book lends earnings visibility.
Favourable outlook for the AC industry to augur well for
Cooling products business which is out pacing the market
Blue Star
5,298
554
634
14.4
growth. EMPPAC division's profitability to improve once
operating environment turns around.
With a focus on the low and medium income (LMI) consumer
Dewan Housing Finance
10,296
329
350
6.4
segment, the company has increased its presence in tier-II &
III cities where the growth opportunity is immense.
Strong loan growth backed by diversified loan portfolio and
Equitas Holdings
5,754
171
235
37.8
adequate CAR. ROE & ROA likely to remain decent as risk of
dilution remains low. Attractive valuations considering growth.
Economic recovery to have favourable impact on advertising
& circulation revenue growth. Further, the acquisition of a
Jagran Prakashan
6,107
187
225
20.4
radio business (Radio City) would also boost the company's
revenue growth.
High order book execution in EPC segment, rising B2C sales
KEI Industries
1,307
168
207
23.2
and higher exports to boost the revenues and profitability
Speedier execution and speedier sales, strong revenue visibilty
Mahindra Lifespace
1,437
350
522
49.1
in short-to-long run, attractive valuations
Higher growth in domestic branded sales and healthy export
Mirza International
1,072
89
107
20.1
to boost the profitability.
Massive capacity expansion along with rail advantage at ICD
Navkar Corporation
2,353
165
265
60.6
as well CFS augurs well for the company
Market leadership in Hindi news genre and no. 2 viewership
ranking in English news genre, exit from the radio business,
TV Today Network
1,521
255
344
35.0
and anticipated growth in ad spends by corporates to benefit
the stock.
Source: Company, Angel Research
Market Outlook
March 08, 2017
Key Upcoming Events
Global economic events release calendar
Bloomberg Data
Date
Time
Country
Event Description
Unit
Period
Last Reported
Estimated
Mar 08, 2017
China
Exports YoY%
% Change
Feb
7.90
14.00
Mar 09, 2017
7:00 AM China
Consumer Price Index (YoY)
% Change
Feb
2.50
1.70
7:00 PM US
Initial Jobless claims
Thousands
Mar 4
223.00
238.00
6:15 PM Euro Zone ECB announces interest rates
%
Mar 9
0.00
0.00
Mar 10, 2017
3:00 PM UK
Industrial Production (YoY)
% Change
Jan
4.30
3.20
India
Imports YoY%
% Change
Feb
10.70
India
Exports YoY%
% Change
Feb
4.30
5:30 PM India
Industrial Production YoY
% Change
Jan
-0.40
7:00 PM US
Change in Nonfarm payrolls
Thousands
Feb
227.00
190.00
7:00 PM US
Unnemployment rate
%
Feb
4.80
4.70
Mar 14, 2017 12:00 PM India
Monthly Wholesale Prices YoY%
% Change
Feb
5.25
US
Producer Price Index (mom)
% Change
Feb
1.10
Mar 15, 2017
3:00 PM UK
Jobless claims change
% Change
Feb
-42.40
6:00 PM US
Consumer price index (mom)
% Change
Feb
0.60
0.00
11:30 PM US
FOMC rate decision
%
Mar 15
0.75
0.75
Mar 16, 2017
3:30 PM Euro Zone Euro-Zone CPI (YoY)
%
Feb F
2.00
6:00 PM US
Building permits
Thousands
Feb
1293.00
1250.00
6:00 PM US
Housing Starts
Thousands
Feb
1246.00
1255.00
5:30 PM UK
BOE Announces rates
% Ratio
Mar 16
0.25
Mar 17, 2017
6:45 PM US
Industrial Production
%
Feb
(0.25)
0.20
Mar 21, 2017
3:00 PM UK
CPI (YoY)
% Change
Feb
1.80
Mar 22, 2017
7:30 PM US
Existing home sales
Million
Feb
5.69
5.60
Mar 23, 2017
8:30 PM Euro Zone Euro-Zone Consumer Confidence
Value
Mar A
(6.20)
7:30 PM US
New home sales
Thousands
Feb
555.00
565.00
Mar 24, 2017
2:00 PM Germany PMI Services
Value
Mar P
54.40
Source: Bloomberg, Angel Research
Market Outlook
March 08, 2017
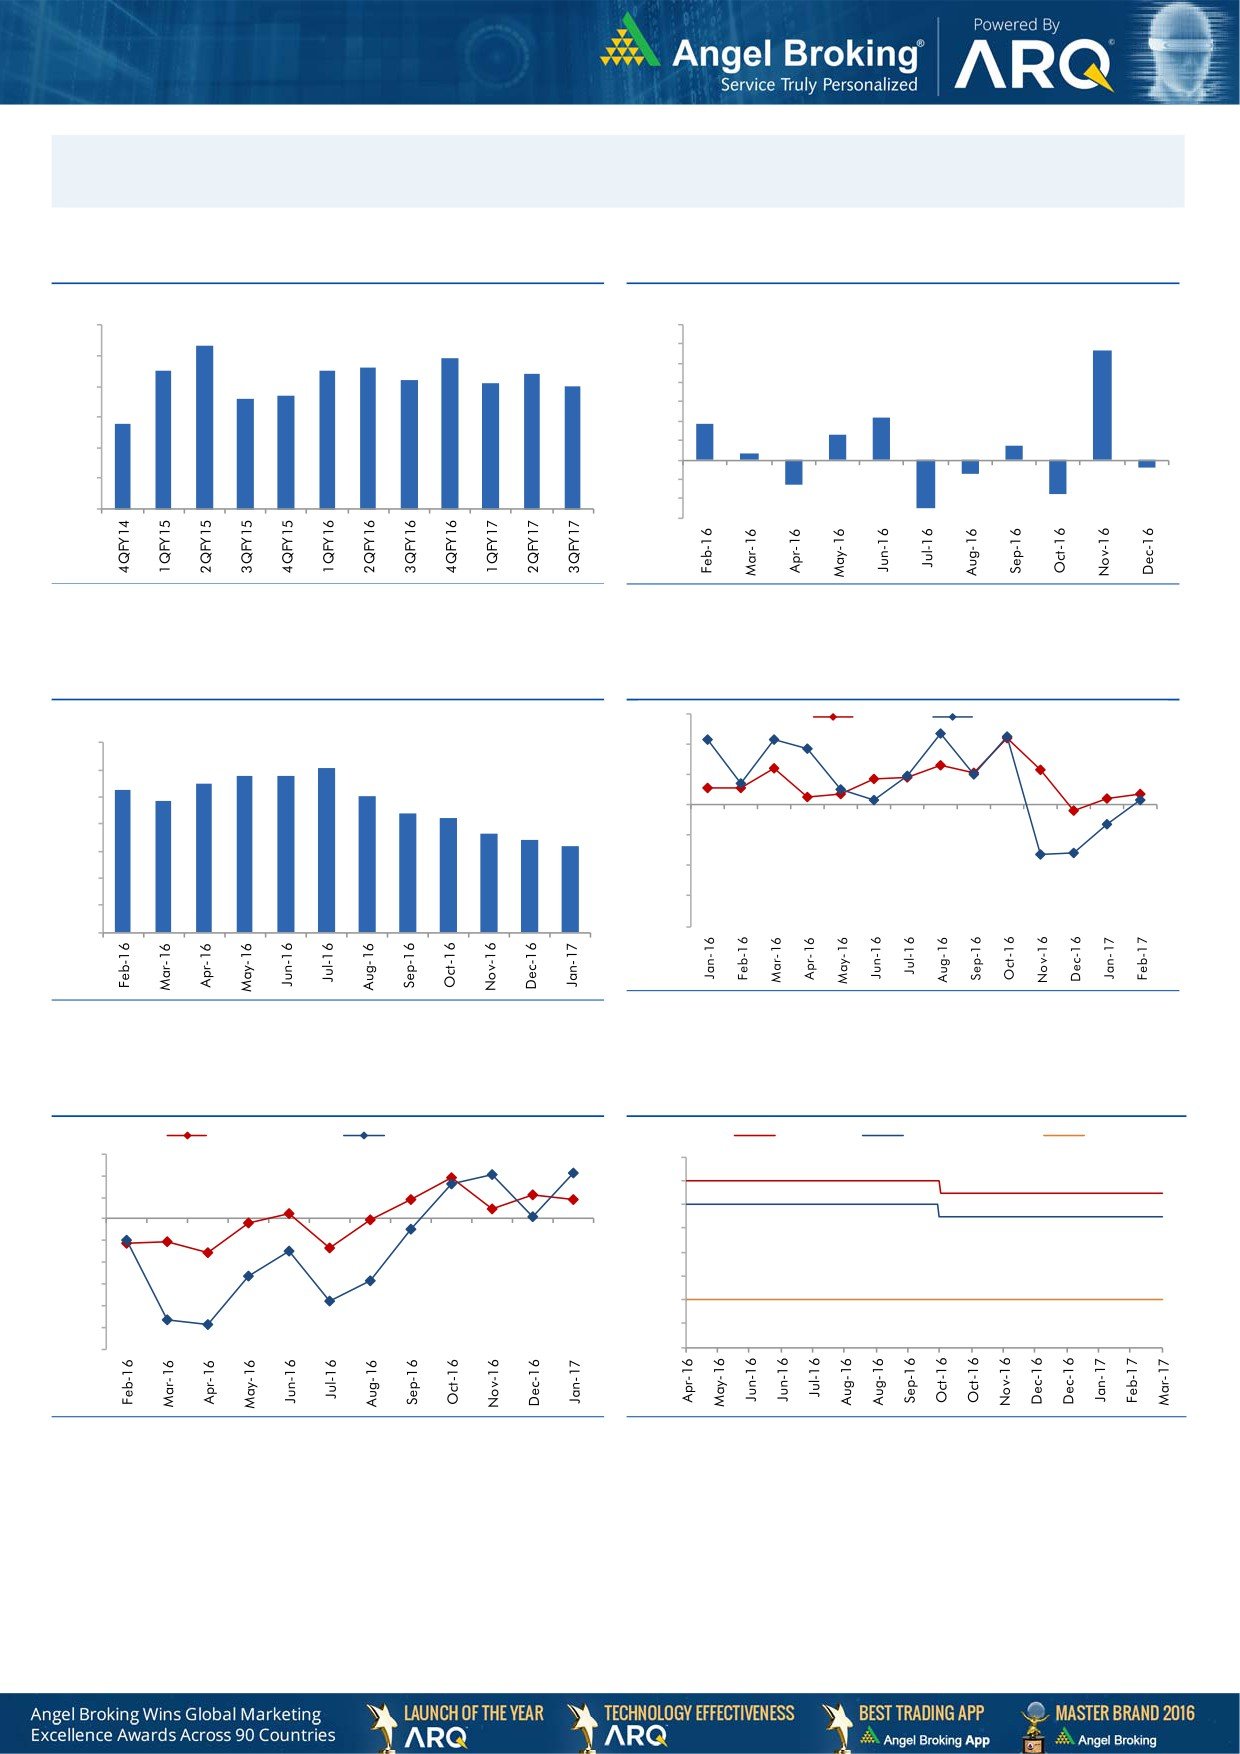
Macro watch
Exhibit 1: Quarterly GDP trends
Exhibit 2: IIP trends
(%)
(%)
9.0
8.3
7.0
5.7
7.9
6.0
8.0
7.5
7.5
7.6
7.4
7.2
5.0
7.1
7.0
6.6
6.7
4.0
7.0
3.0
2.2
5.8
1.9
6.0
2.0
1.3
0.7
1.0
0.3
5.0
-
4.0
(1.0)
(0.7)
(0.4)
(2.0)
3.0
(1.3)
(1.8)
(3.0)
(2.5)
Source: CSO, Angel Research
Source: MOSPI, Angel Research
Exhibit 3: Monthly CPI inflation trends
Exhibit 4: Manufacturing and services PMI
56.0
Mfg. PMI
Services PMI
(%)
7.0
54.0
6.1
5.8
5.8
6.0
5.3
5.5
5.1
52.0
4.8
5.0
4.4
4.2
50.0
3.6
4.0
3.4
3.2
48.0
3.0
46.0
2.0
44.0
1.0
42.0
-
Source: Market, Angel Research; Note: Level above 50 indicates expansion
Source: MOSPI, Angel Research
Exhibit 5: Exports and imports growth trends
Exhibit 6: Key policy rates
(%)
Exports yoy growth
Imports yoy growth
(%)
Repo rate
Reverse Repo rate
CRR
15.0
7.00
10.0
6.50
5.0
6.00
0.0
5.50
(5.0)
5.00
(10.0)
4.50
(15.0)
4.00
(20.0)
(25.0)
3.50
(30.0)
3.00
Source: Bloomberg, Angel Research
Source: RBI, Angel Research
Stock Watch
March 08, 2017
Company Name
Reco
CMP
Target
Mkt Cap
Sales ( Čcr )
OPM(%)
EPS (Č)
PER(x)
P/BV(x)
RoE(%)
EV/Sales(x)
(Č)
Price ( Č)
( Č cr )
FY17E FY18E
FY17E
FY18E
FY17E
FY18E
FY17E
FY18E
FY17E
FY18E
FY17E
FY18E
FY17E
FY18E
Agri / Agri Chemical
Rallis
Neutral
239
-
4,639
1,937
2,164
13.3
14.3
9.0
11.0
26.5
21.7
4.6
4.0
18.4
19.8
2.4
2.1
United Phosphorus
Neutral
702
-
35,608
15,176
17,604
18.5
18.5
37.4
44.6
18.8
15.8
3.7
3.1
21.4
21.2
2.5
2.1
Auto & Auto Ancillary
Ashok Leyland
Buy
91
111
25,983
20,021
21,915
11.6
11.9
4.5
5.3
20.3
17.2
4.1
3.7
20.6
21.5
1.2
1.1
Bajaj Auto
Neutral
2,877
-
83,238
25,093
27,891
19.5
19.2
143.9
162.5
20.0
17.7
5.6
4.8
30.3
29.4
3.0
2.7
Bharat Forge
Neutral
1,048
-
24,395
7,726
8,713
20.5
21.2
35.3
42.7
29.7
24.5
5.5
5.0
18.9
20.1
3.2
2.8
Eicher Motors
Neutral
23,211
-
63,158
16,583
20,447
17.5
18.0
598.0
745.2
38.8
31.2
13.3
10.1
41.2
38.3
3.6
2.9
Gabriel India
Buy
113
130
1,619
1,544
1,715
9.0
9.3
5.4
6.3
20.9
17.9
3.9
3.5
18.9
19.5
1.0
0.9
Hero Motocorp
Neutral
3,299
-
65,888
28,083
30,096
15.3
15.7
171.8
187.0
19.2
17.6
6.7
5.6
30.1
27.9
2.2
2.0
Jamna Auto Industries Neutral
208
-
1,653
1,486
1,620
9.8
9.9
15.0
17.2
13.8
12.1
3.0
2.6
21.8
21.3
1.2
1.1
L G Balakrishnan & Bros Neutral
568
-
892
1,302
1,432
11.6
11.9
43.7
53.0
13.0
10.7
1.8
1.7
13.8
14.2
0.8
0.7
Mahindra and Mahindra Neutral
1,320
-
81,975
46,534
53,077
11.6
11.7
67.3
78.1
19.6
16.9
3.2
2.8
15.4
15.8
1.7
1.5
Maruti
Accumulate
5,886
6,560
177,806
67,822
83,288
16.0
16.4
253.8
312.4
23.2
18.8
5.3
4.3
23.0
22.9
2.3
1.8
Minda Industries
Neutral
436
-
3,455
2,728
3,042
9.0
9.1
68.2
86.2
6.4
5.1
1.5
1.2
23.8
24.3
1.3
1.2
Motherson Sumi
Neutral
354
-
49,638
45,896
53,687
7.8
8.3
13.0
16.1
27.1
22.0
8.7
7.0
34.7
35.4
1.2
1.0
Rane Brake Lining
Neutral
938
-
743
511
562
11.3
11.5
28.1
30.9
33.4
30.4
5.1
4.6
15.3
15.0
1.6
1.5
Setco Automotive
Neutral
35
-
469
741
837
13.0
13.0
15.2
17.0
2.3
2.1
0.4
0.3
15.8
16.3
1.0
0.9
Tata Motors
Neutral
467
-
134,868
300,209
338,549
8.9
8.4
42.7
54.3
11.0
8.6
1.8
1.5
15.6
17.2
0.6
0.5
TVS Motor
Neutral
425
-
20,175
13,390
15,948
6.9
7.1
12.8
16.5
33.3
25.7
8.3
6.6
26.3
27.2
1.5
1.3
Amara Raja Batteries
Buy
842
1,009
14,386
5,305
6,100
16.0
16.3
28.4
34.0
29.7
24.8
5.7
4.8
19.3
19.3
2.7
2.4
Exide Industries
Neutral
214
-
18,199
7,439
8,307
15.0
15.0
8.1
9.3
26.4
23.0
3.7
3.3
14.3
16.7
2.1
1.8
Apollo Tyres
Buy
181
235
9,224
12,877
14,504
14.3
13.9
21.4
23.0
8.5
7.9
1.3
1.1
16.4
15.2
0.9
0.8
Ceat
Buy
1,168
1,450
4,725
7,524
8,624
13.0
12.7
131.1
144.3
8.9
8.1
1.6
1.4
19.8
18.6
0.7
0.6
JK Tyres
Neutral
120
-
2,722
7,455
8,056
15.0
15.0
21.8
24.5
5.5
4.9
1.2
0.9
22.8
21.3
0.5
0.4
Swaraj Engines
Neutral
1,372
-
1,705
660
810
15.2
16.4
54.5
72.8
25.2
18.9
7.9
7.1
31.5
39.2
2.4
1.9
Subros
Neutral
197
-
1,181
1,488
1,681
11.7
11.9
6.4
7.2
30.8
27.5
3.3
3.0
10.8
11.4
1.0
0.9
Indag Rubber
Neutral
188
-
494
286
326
19.8
16.8
11.7
13.3
16.1
14.1
2.7
2.5
17.8
17.1
1.4
1.2
Capital Goods
ACE
Neutral
55
-
548
709
814
4.1
4.6
1.4
2.1
39.6
26.4
1.6
1.5
4.4
6.0
0.9
0.8
BEML
Neutral
1,291
-
5,378
3,451
4,055
6.3
9.2
31.4
57.9
41.1
22.3
2.5
2.2
6.3
10.9
1.7
1.4
Bharat Electronics
Neutral
1,531
-
34,186
8,137
9,169
16.8
17.2
58.7
62.5
26.1
24.5
4.0
3.6
44.6
46.3
3.2
2.9
Stock Watch
March 08, 2017
Company Name
Reco
CMP
Target
Mkt Cap
Sales ( Čcr )
OPM(%)
EPS (Č)
PER(x)
P/BV(x)
RoE(%)
EV/Sales(x)
(Č)
Price ( Č)
( Č cr )
FY17E
FY18E
FY17E
FY18E
FY17E
FY18E
FY17E
FY18E
FY17E
FY18E
FY17E
FY18E
FY17E
FY18E
Capital Goods
Voltas
Accumulate
386
407
12,785
6,511
7,514
7.9
8.7
12.9
16.3
30.0
23.7
5.4
4.7
16.7
18.5
1.7
1.5
BGR Energy
Neutral
136
-
980
16,567
33,848
6.0
5.6
7.8
5.9
17.4
23.0
1.0
1.0
4.7
4.2
0.2
0.1
BHEL
Neutral
160
-
39,260
28,797
34,742
-
2.8
2.3
6.9
69.7
23.3
1.2
1.2
1.3
4.8
1.0
0.7
Blue Star
Accumulate
554
634
5,298
4,283
5,077
5.9
7.3
14.9
22.1
37.2
25.1
7.2
6.1
20.4
26.4
1.3
1.1
Crompton Greaves
Neutral
71
-
4,441
5,777
6,120
5.9
7.0
3.3
4.5
21.5
15.7
0.9
0.9
4.4
5.9
0.7
0.6
Greaves Cotton
Neutral
159
-
3,882
1,755
1,881
16.8
16.9
7.8
8.5
20.4
18.7
4.1
3.8
20.6
20.9
1.9
1.7
Inox Wind
Neutral
169
-
3,740
5,605
6,267
15.7
16.4
24.8
30.0
6.8
5.6
1.9
1.4
25.9
24.4
0.7
0.6
KEC International
Neutral
167
-
4,292
9,294
10,186
7.9
8.1
9.9
11.9
16.9
14.0
2.5
2.2
15.6
16.3
0.7
0.6
KEI Industries
Buy
168
207
1,307
2,682
3,058
10.4
10.0
11.7
12.8
14.3
13.1
2.9
2.4
20.1
18.2
0.7
0.6
Thermax
Neutral
872
-
10,387
5,421
5,940
7.3
7.3
25.7
30.2
33.9
28.9
4.1
3.8
12.2
13.1
1.8
1.7
VATech Wabag
Buy
569
681
3,105
3,136
3,845
8.9
9.1
26.0
35.9
21.9
15.9
2.7
2.3
13.4
15.9
0.9
0.7
Cement
ACC
Neutral
1,387
-
26,048
11,225
13,172
13.2
16.9
44.5
75.5
31.2
18.4
3.0
2.7
11.2
14.2
2.3
2.0
Ambuja Cements
Neutral
225
-
44,697
9,350
10,979
18.2
22.5
5.8
9.5
38.8
23.7
3.3
2.9
10.2
12.5
4.8
4.1
India Cements
Neutral
163
-
5,021
4,364
4,997
18.5
19.2
7.9
11.3
20.7
14.5
1.5
1.5
8.0
8.5
1.9
1.7
JK Cement
Neutral
862
-
6,023
4,398
5,173
15.5
17.5
31.2
55.5
27.6
15.5
3.3
2.9
12.0
15.5
1.9
1.6
J K Lakshmi Cement
Neutral
410
-
4,823
2,913
3,412
14.5
19.5
7.5
22.5
54.7
18.2
3.4
2.8
12.5
18.0
2.2
1.9
Orient Cement
Neutral
139
-
2,855
2,114
2,558
18.5
20.5
8.1
11.3
17.2
12.3
2.5
2.1
9.0
14.0
2.0
1.5
UltraTech Cement
Neutral
3,788
-
103,962
25,768
30,385
21.0
23.5
111.0
160.0
34.1
23.7
4.4
3.8
13.5
15.8
4.1
3.4
Construction
ITNL
Neutral
102
-
3,354
8,946
10,017
31.0
31.6
8.1
9.1
12.6
11.2
0.5
0.5
4.2
5.0
3.7
3.4
KNR Constructions
Neutral
182
-
2,552
1,385
1,673
14.7
14.0
41.2
48.5
4.4
3.7
0.8
0.7
14.9
15.2
1.9
1.6
Larsen & Toubro
Accumulate
1,485
1,634
138,513
111,017
124,908
11.0
11.0
61.1
66.7
24.3
22.3
2.9
2.7
13.1
12.9
2.3
2.1
Gujarat Pipavav Port
Neutral
159
-
7,682
705
788
52.2
51.7
5.0
5.6
31.8
28.4
3.1
2.8
11.2
11.2
10.5
8.9
Nagarjuna Const.
Neutral
80
-
4,445
8,842
9,775
9.1
8.8
5.3
6.4
15.1
12.5
1.2
1.1
8.2
9.1
0.7
0.6
PNC Infratech
Buy
104
143
2,662
2,350
2,904
13.1
13.2
9.0
8.8
11.5
11.8
0.4
0.4
15.9
13.9
1.3
1.0
Simplex Infra
Neutral
290
-
1,437
6,829
7,954
10.5
10.5
31.4
37.4
9.3
7.8
1.0
0.9
9.9
13.4
0.6
0.5
Power Mech Projects
Neutral
415
-
610
1,801
2,219
12.7
14.6
72.1
113.9
5.8
3.6
1.1
0.9
16.8
11.9
0.3
0.2
Sadbhav Engineering
Accumulate
280
298
4,807
3,598
4,140
10.3
10.6
9.0
11.9
31.1
23.6
3.3
2.9
9.9
11.9
1.6
1.4
NBCC
Neutral
167
-
15,030
7,428
9,549
7.9
8.6
8.2
11.0
20.4
15.2
1.0
0.8
28.2
28.7
1.7
1.3
MEP Infra
Neutral
47
-
765
1,877
1,943
30.6
29.8
3.0
4.2
15.7
11.2
7.6
5.1
0.6
0.6
1.8
1.6
Stock Watch
March 08, 2017
Company Name
Reco
CMP
Target
Mkt Cap
Sales ( Čcr )
OPM(%)
EPS (Č)
PER(x)
P/BV(x)
RoE(%)
EV/Sales(x)
(Č)
Price ( Č)
( Č cr )
FY17E
FY18E
FY17E
FY18E
FY17E
FY18E
FY17E
FY18E
FY17E
FY18E
FY17E
FY18E
FY17E
FY18E
Construction
SIPL
Neutral
96
-
3,367
1,036
1,252
65.5
66.2
(8.4)
(5.6)
3.6
4.1
(22.8)
(15.9)
11.5
9.5
Engineers India
Neutral
145
-
9,785
1,725
1,935
16.0
19.1
11.4
13.9
12.7
10.5
1.8
1.7
13.4
15.3
4.6
4.1
Financials
Axis Bank
Accumulate
512
580
122,447
46,932
53,575
3.5
3.4
32.4
44.6
15.8
11.5
2.0
1.8
13.6
16.5
-
-
Bank of Baroda
Neutral
160
-
36,936
19,980
23,178
1.8
1.8
11.5
17.3
13.9
9.3
1.6
1.3
8.3
10.1
-
-
Canara Bank
Neutral
289
-
15,709
15,225
16,836
1.8
1.8
14.5
28.0
20.0
10.3
1.4
1.1
5.8
8.5
-
-
Can Fin Homes
Accumulate
1,957
2,128
5,209
420
526
3.5
3.5
86.5
107.8
22.6
18.2
4.9
4.0
23.6
24.1
-
-
Cholamandalam Inv. &
Buy
934
1,230
14,596
2,012
2,317
6.3
6.3
42.7
53.6
21.9
17.4
3.5
3.0
16.9
18.3
-
-
Fin. Co.
Dewan Housing Finance Accumulate
329
350
10,296
2,225
2,688
2.9
2.9
29.7
34.6
11.1
9.5
1.8
1.5
16.1
16.8
-
-
Equitas Holdings
Buy
171
235
5,754
939
1,281
11.7
11.5
5.8
8.2
29.4
20.8
2.5
2.3
10.9
11.5
-
-
Federal Bank
Neutral
85
-
14,576
8,259
8,995
3.0
3.0
4.3
5.6
19.7
15.1
1.7
1.5
8.5
10.1
-
-
HDFC
Neutral
1,365
-
216,495
11,475
13,450
3.4
3.4
45.3
52.5
30.1
26.0
5.8
5.1
20.2
20.5
-
-
HDFC Bank
Neutral
1,386
-
354,865
46,097
55,433
4.5
4.5
58.4
68.0
23.7
20.4
4.2
3.5
18.8
18.6
-
-
ICICI Bank
Accumulate
276
315
160,738
42,800
44,686
3.1
3.3
18.0
21.9
15.3
12.6
2.1
1.9
11.1
12.3
-
-
Lakshmi Vilas Bank
Neutral
168
-
3,213
3,339
3,799
2.7
2.8
11.0
14.0
15.3
12.0
1.6
1.5
11.2
12.7
-
-
LIC Housing Finance
Accumulate
568
630
28,640
3,712
4,293
2.6
2.5
39.0
46.0
14.6
12.3
2.7
2.3
19.9
20.1
-
-
Punjab Natl.Bank
Neutral
142
-
30,143
23,532
23,595
2.3
2.4
6.8
12.6
20.8
11.2
3.2
2.3
3.3
6.5
-
-
RBL Bank
Neutral
474
-
17,540
1,783
2,309
2.6
2.6
12.7
16.4
37.4
28.9
4.1
3.6
12.8
13.3
-
-
Repco Home Finance
Buy
635
825
3,971
388
457
4.5
4.2
30.0
38.0
21.2
16.7
3.5
3.0
18.0
19.2
-
-
South Ind.Bank
Neutral
21
-
2,785
6,435
7,578
2.5
2.5
2.7
3.1
7.6
6.7
1.0
0.8
10.1
11.2
-
-
St Bk of India
Neutral
268
-
213,730
88,650
98,335
2.6
2.6
13.5
18.8
19.9
14.3
1.9
1.7
7.0
8.5
-
-
Union Bank
Neutral
149
-
10,215
13,450
14,925
2.3
2.3
25.5
34.5
5.8
4.3
0.9
0.7
7.5
10.2
-
-
Yes Bank
Neutral
1,449
-
61,325
8,978
11,281
3.3
3.4
74.0
90.0
19.6
16.1
3.7
3.2
17.0
17.2
-
-
FMCG
Akzo Nobel India
Accumulate
1,601
1,720
7,680
2,955
3,309
13.3
13.7
57.2
69.3
28.0
23.1
9.2
7.7
32.7
33.3
2.4
2.1
Asian Paints
Neutral
1,023
-
98,112
17,128
18,978
16.8
16.4
19.1
20.7
53.6
49.4
18.6
17.6
34.8
35.5
5.6
5.1
Britannia
Buy
3,059
3,626
36,708
9,594
11,011
14.6
14.9
80.3
94.0
38.1
32.5
15.7
12.1
41.2
-
3.7
3.2
Colgate
Accumulate
925
995
25,161
4,605
5,149
23.4
23.4
23.8
26.9
38.9
34.4
21.5
16.8
64.8
66.8
5.4
4.8
Dabur India
Accumulate
276
304
48,600
8,315
9,405
19.8
20.7
8.1
9.2
34.1
30.0
9.5
7.9
31.6
31.0
5.5
4.8
GlaxoSmith Con*
Neutral
5,198
-
21,860
4,350
4,823
21.2
21.4
179.2
196.5
29.0
26.5
7.7
6.5
27.1
26.8
4.4
3.9
Godrej Consumer
Neutral
1,631
-
55,566
10,235
11,428
18.4
18.6
41.1
44.2
39.7
36.9
8.8
7.4
24.9
24.8
5.5
4.9
Stock Watch
March 08, 2017
Company Name
Reco
CMP
Target
Mkt Cap
Sales ( Čcr )
OPM(%)
EPS (Č)
PER(x)
P/BV(x)
RoE(%)
EV/Sales(x)
(Č)
Price ( Č)
( Č cr )
FY17E FY18E
FY17E
FY18E
FY17E
FY18E
FY17E
FY18E
FY17E
FY18E
FY17E
FY18E
FY17E
FY18E
FMCG
HUL
Neutral
873
-
188,857
35,252
38,495
17.8
17.8
20.7
22.4
42.3
39.0
40.4
34.6
95.6
88.9
5.2
4.8
ITC
Accumulate
264
284
320,741
40,059
44,439
38.3
39.2
9.0
10.1
29.4
26.1
8.2
7.2
27.8
27.5
7.5
6.8
Marico
Accumulate
279
300
36,001
6,430
7,349
18.8
19.5
6.4
7.7
43.6
36.2
13.2
11.1
33.2
32.5
5.4
4.7
Nestle*
Neutral
6,303
-
60,766
10,073
11,807
20.7
21.5
124.8
154.2
50.5
40.9
20.7
18.7
34.8
36.7
5.8
5.0
Tata Global
Neutral
143
-
9,009
8,675
9,088
9.8
9.8
7.4
8.2
19.3
17.4
1.5
1.5
7.9
8.1
1.0
0.9
Procter & Gamble
Accumulate
6,949
7,369
22,556
2,939
3,342
23.2
23.0
146.2
163.7
47.5
42.5
12.0
10.0
25.3
23.5
7.2
6.3
Hygiene
IT
HCL Tech^
Buy
856
1,000
120,772
49,242
57,168
20.5
20.5
55.7
64.1
15.4
13.4
3.1
2.4
20.3
17.9
2.3
1.9
Infosys
Buy
1,020
1,249
234,219
68,350
77,326
27.0
27.0
62.5
69.4
16.3
14.7
3.5
3.2
21.3
21.6
2.9
2.5
TCS
Accumulate
2,501
2,700
492,745
119,025
133,308
27.6
27.6
131.2
145.5
19.1
17.2
6.2
5.7
32.4
33.1
3.9
3.5
Tech Mahindra
Buy
500
600
48,652
29,673
32,937
15.5
17.0
32.8
39.9
15.2
12.5
3.0
2.6
19.6
20.7
1.4
1.2
Wipro
Buy
494
583
120,037
55,440
60,430
18.1
18.1
36.1
38.9
13.7
12.7
2.5
2.3
19.0
17.6
1.9
1.7
Media
D B Corp
Neutral
378
-
6,948
2,297
2,590
27.4
28.2
21.0
23.4
18.0
16.2
4.2
3.6
23.7
23.1
2.8
2.4
HT Media
Neutral
85
-
1,989
2,693
2,991
12.6
12.9
7.9
9.0
10.8
9.5
0.9
0.9
7.8
8.3
0.3
0.2
Jagran Prakashan
Buy
187
225
6,107
2,355
2,635
28.0
28.0
10.8
12.5
17.3
15.0
3.8
3.2
21.7
21.7
2.6
2.3
Sun TV Network
Neutral
742
-
29,221
2,850
3,265
70.1
71.0
26.2
30.4
28.3
24.4
7.2
6.4
24.3
25.6
9.8
8.5
Hindustan Media
Neutral
272
-
1,997
1,016
1,138
24.3
25.2
27.3
30.1
10.0
9.0
1.9
1.7
16.2
15.8
1.3
1.1
Ventures
TV Today Network
Buy
255
344
1,521
567
645
26.7
27.0
15.4
18.1
16.6
14.1
2.5
2.2
14.9
15.2
2.2
1.9
Metals & Mining
Coal India
Neutral
323
-
200,406
84,638
94,297
21.4
22.3
24.5
27.1
13.2
11.9
5.5
5.2
42.6
46.0
1.9
1.7
Hind. Zinc
Neutral
299
-
126,274
14,252
18,465
55.9
48.3
15.8
21.5
18.9
13.9
3.1
2.7
17.0
20.7
8.9
6.8
Hindalco
Neutral
193
-
39,778
107,899
112,095
7.4
8.2
9.2
13.0
20.9
14.8
1.0
1.0
4.8
6.6
0.9
0.8
JSW Steel
Neutral
181
-
43,848
53,201
58,779
16.1
16.2
130.6
153.7
1.4
1.2
0.2
0.2
14.0
14.4
1.6
1.4
NMDC
Neutral
147
-
46,604
6,643
7,284
44.4
47.7
7.1
7.7
20.8
19.1
1.8
1.8
8.8
9.2
4.8
4.3
SAIL
Neutral
60
-
24,946
47,528
53,738
(0.7)
2.1
(1.9)
2.6
23.2
0.7
0.6
(1.6)
3.9
1.4
1.2
Vedanta
Neutral
260
-
77,186
71,744
81,944
19.2
21.7
13.4
20.1
19.4
13.0
1.7
1.5
8.4
11.3
1.5
1.1
Tata Steel
Neutral
482
-
46,813
121,374
121,856
7.2
8.4
18.6
34.3
25.9
14.1
1.6
1.5
6.1
10.1
1.0
1.0
Oil & Gas
Cairn India
Neutral
289
-
54,166
9,127
10,632
4.3
20.6
8.8
11.7
32.8
24.7
1.1
1.0
3.3
4.2
7.4
6.2
GAIL
Neutral
524
-
66,449
56,220
65,198
9.3
10.1
27.1
33.3
19.3
15.7
1.8
1.7
9.3
10.7
1.4
1.2
ONGC
Neutral
196
-
251,852
137,222
152,563
15.0
21.8
19.5
24.1
10.1
8.1
0.9
0.8
8.5
10.1
2.1
1.9
Indian Oil Corp
Neutral
379
-
183,893
373,359
428,656
5.9
5.5
54.0
59.3
7.0
6.4
1.1
1.0
16.0
15.6
0.6
0.6
Stock Watch
March 08, 2017
Company Name
Reco
CMP
Target
Mkt Cap
Sales ( Čcr )
OPM(%)
EPS (Č)
PER(x)
P/BV(x)
RoE(%)
EV/Sales(x)
(Č)
Price ( Č)
( Č cr )
FY17E FY18E
FY17E
FY18E
FY17E
FY18E
FY17E
FY18E
FY17E
FY18E
FY17E
FY18E
FY17E
FY18E
Oil & Gas
Reliance Industries
Neutral
1,305
-
423,275
301,963
358,039
12.1
12.6
87.7
101.7
14.9
12.8
1.5
1.4
10.7
11.3
1.9
1.6
Pharmaceuticals
Alembic Pharma
Buy
589
689
11,094
3,483
4,244
20.2
21.4
24.3
33.6
24.2
17.5
5.5
4.4
25.5
25.3
3.1
2.5
Alkem Laboratories Ltd
Accumulate
2,049
2,257
24,494
6,065
7,009
18.7
20.0
80.2
92.0
25.6
22.3
5.7
4.8
22.5
21.6
4.0
3.4
Aurobindo Pharma
Buy
666
877
38,952
15,720
18,078
23.7
23.7
41.4
47.3
16.1
14.1
4.2
3.3
29.6
26.1
2.7
2.3
Aventis*
Neutral
4,302
-
9,908
2,277
2,597
17.3
18.3
149.4
172.0
28.8
25.0
4.8
3.8
25.1
28.8
4.0
3.3
Cadila Healthcare
Neutral
436
-
44,604
10,429
12,318
17.7
21.6
13.1
19.2
33.3
22.7
7.0
5.5
22.8
27.1
4.3
3.6
Cipla
Sell
588
465
47,271
15,378
18,089
15.7
16.8
19.3
24.5
30.5
24.0
3.6
3.2
12.3
13.9
3.2
2.7
Dr Reddy's
Neutral
2,852
-
47,254
16,043
18,119
18.0
23.0
78.6
130.9
36.3
21.8
3.5
3.1
10.1
15.2
2.7
2.6
Dishman Pharma
Neutral
238
-
3,839
1,718
1,890
22.7
22.8
9.5
11.3
25.0
21.1
2.4
2.2
10.1
10.9
2.7
2.4
GSK Pharma*
Neutral
2,693
-
22,807
2,800
3,290
10.2
20.6
32.2
60.3
83.6
44.7
15.5
15.3
17.2
34.5
7.9
6.8
Indoco Remedies
Reduce
265
240
2,438
1,112
1,289
16.2
18.2
11.6
16.0
22.8
16.5
3.6
3.1
17.0
20.1
2.3
1.9
Ipca labs
Accumulate
549
613
6,924
3,258
3,747
12.8
15.3
12.1
19.2
45.4
28.6
2.8
2.6
6.4
9.5
2.3
2.0
Lupin
Buy
1,456
1,809
65,720
15,912
18,644
26.4
26.7
58.1
69.3
25.1
21.0
4.9
4.0
21.4
20.9
4.2
3.5
Sun Pharma
Buy
679
847
162,968
31,129
35,258
32.0
32.9
30.2
35.3
22.5
19.2
3.7
3.0
20.0
20.1
4.8
4.1
Power
Tata Power
Neutral
83
-
22,450
36,916
39,557
17.4
27.1
5.1
6.3
16.3
13.2
1.4
1.3
9.0
10.3
1.6
1.5
NTPC
Neutral
158
-
129,949
86,605
95,545
17.5
20.8
11.8
13.4
13.4
11.8
1.4
1.3
10.5
11.1
2.8
2.8
Power Grid
Accumulate
195
223
101,781
25,315
29,193
88.2
88.7
14.2
17.2
13.7
11.3
2.1
1.8
15.2
16.1
8.7
7.8
Real Estate
Prestige Estate
Buy
173
210
6,482
4,707
5,105
25.2
26.0
10.3
13.0
16.8
13.3
1.4
1.3
10.3
10.2
2.5
2.3
MLIFE
Buy
350
522
1,437
1,152
1,300
22.7
24.6
29.9
35.8
11.7
9.8
0.9
0.8
7.6
8.6
2.0
1.6
Telecom
Bharti Airtel
Neutral
361
-
144,386
105,086
114,808
34.5
34.7
12.2
16.4
29.6
22.0
2.0
1.9
6.8
8.4
2.3
2.0
Idea Cellular
Neutral
109
-
39,116
40,133
43,731
37.2
37.1
6.4
6.5
17.0
16.7
1.4
1.3
8.2
7.6
2.0
1.7
zOthers
Abbott India
Neutral
4,480
-
9,520
3,153
3,583
14.1
14.4
152.2
182.7
29.4
24.5
144.5
123.4
25.6
26.1
2.7
2.3
Asian Granito
Buy
287
351
863
1,060
1,169
12.2
12.5
12.7
15.9
22.6
18.1
2.2
1.9
9.5
10.7
1.1
1.0
Bajaj Electricals
Accumulate
273
295
2,768
4,801
5,351
5.7
6.2
10.4
13.7
26.2
20.0
3.2
2.9
12.4
14.5
0.6
0.5
Banco Products (India)
Neutral
199
-
1,424
1,353
1,471
12.3
12.4
14.5
16.3
13.7
12.2
19.0
17.1
14.5
14.6
1.0
106.3
Coffee Day Enterprises
Neutral
234
-
4,820
2,964
3,260
20.5
21.2
4.7
8.0
-
29.2
2.7
2.5
5.5
8.5
2.0
1.8
Ltd
Competent Automobiles Neutral
174
-
107
1,137
1,256
3.1
2.7
28.0
23.6
6.2
7.4
33.6
30.3
14.3
11.5
0.1
0.1
Elecon Engineering
Neutral
53
-
599
1,482
1,660
13.7
14.5
3.9
5.8
13.7
9.2
3.2
3.0
7.8
10.9
0.7
0.6
Finolex Cables
Neutral
438
-
6,706
2,883
3,115
12.0
12.1
14.2
18.6
30.9
23.6
16.4
14.4
15.8
14.6
2.0
1.8
Stock Watch
March 08, 2017
Company Name
Reco
CMP
Target
Mkt Cap
Sales ( Čcr )
OPM(%)
EPS (Č)
PER(x)
P/BV(x)
RoE(%)
EV/Sales(x)
(Č)
Price ( Č)
( Č cr )
FY17E
FY18E
FY17E
FY18E
FY17E
FY18E
FY17E
FY18E
FY17E
FY18E
FY17E
FY18E
FY17E
FY18E
zOthers
Garware Wall Ropes
Neutral
679
-
1,487
863
928
15.1
15.2
36.4
39.4
18.7
17.2
3.4
2.9
17.5
15.9
1.6
1.5
Goodyear India*
Neutral
707
-
1,630
1,598
1,704
10.4
10.2
49.4
52.6
14.3
13.4
66.1
57.9
18.2
17.0
0.7
97.8
Hitachi
Neutral
1,499
-
4,075
2,081
2,433
8.8
8.9
33.4
39.9
44.9
37.6
36.2
30.2
22.1
21.4
2.0
1.6
HSIL
Neutral
338
-
2,445
2,384
2,515
15.8
16.3
15.3
19.4
22.1
17.4
22.0
18.9
7.8
9.3
1.2
1.1
Interglobe Aviation
Neutral
860
-
31,090
21,122
26,005
14.5
27.6
110.7
132.1
7.8
6.5
46.5
33.2
168.5
201.1
1.4
1.1
Jyothy Laboratories
Neutral
367
-
6,660
1,440
2,052
11.5
13.0
8.5
10.0
43.1
36.7
10.4
9.7
18.6
19.3
4.9
3.4
Kirloskar Engines India
Neutral
391
-
5,649
2,554
2,800
9.9
10.0
10.5
12.1
37.2
32.3
15.6
14.7
10.7
11.7
1.9
1.7
Ltd
Linc Pen & Plastics
Neutral
250
-
370
382
420
9.3
9.5
13.5
15.7
18.6
15.9
3.2
2.8
17.1
17.3
1.0
0.9
M M Forgings
Neutral
485
-
586
546
608
20.4
20.7
41.3
48.7
11.8
10.0
66.5
58.9
16.6
17.0
0.9
0.8
Manpasand Bever.
Neutral
726
-
4,156
836
1,087
19.6
19.4
16.9
23.8
43.0
30.5
5.2
4.5
12.0
14.8
4.7
3.5
Mirza International
Buy
89
107
1,072
963
1,069
17.2
18.0
6.1
7.5
14.5
11.9
2.2
1.9
15.0
15.7
1.3
1.2
MT Educare
Neutral
92
-
368
366
417
17.7
18.2
9.4
10.8
9.9
8.5
2.2
1.9
22.2
22.3
0.9
0.8
Narayana Hrudaya
Neutral
323
-
6,608
1,873
2,166
11.5
11.7
2.6
4.0
122.3
81.6
7.5
6.8
6.1
8.3
3.6
3.1
Navkar Corporation
Buy
165
265
2,353
369
561
42.9
42.3
6.9
11.5
23.9
14.3
1.7
1.5
7.4
10.5
7.4
4.9
Navneet Education
Neutral
148
-
3,466
1,062
1,147
24.0
24.0
6.1
6.6
24.4
22.4
5.0
4.4
20.6
19.8
3.3
3.1
Nilkamal
Neutral
1,933
-
2,885
1,995
2,165
10.7
10.4
69.8
80.6
27.7
24.0
110.5
96.0
16.6
16.5
1.4
1.3
Page Industries
Neutral
14,320
-
15,973
2,450
3,124
20.1
17.6
299.0
310.0
47.9
46.2
318.9
243.5
47.1
87.5
6.6
5.2
Parag Milk Foods
Neutral
222
-
1,868
1,919
2,231
9.3
9.6
9.5
12.9
23.5
17.2
3.7
3.0
15.5
17.5
1.1
1.0
Quick Heal
Neutral
241
-
1,690
408
495
27.3
27.0
7.7
8.8
31.1
27.4
2.9
2.9
9.3
10.6
3.3
2.7
Radico Khaitan
Accumulate
129
147
1,714
1,667
1,824
13.0
13.2
6.7
8.2
19.4
15.7
1.8
1.6
9.0
10.2
1.4
1.3
Relaxo Footwears
Neutral
454
-
5,456
2,085
2,469
9.2
8.2
7.6
8.0
60.1
57.2
23.3
19.9
17.9
18.8
2.7
2.3
S H Kelkar & Co.
Neutral
285
-
4,122
1,036
1,160
15.1
15.0
6.1
7.2
46.7
39.7
5.0
4.6
10.7
11.5
3.8
3.4
Siyaram Silk Mills
Accumulate
1,689
1,872
1,583
1,652
1,857
11.6
11.7
92.4
110.1
18.3
15.3
2.7
2.3
14.7
15.2
1.2
1.0
Styrolution ABS India*
Neutral
615
-
1,081
1,440
1,537
9.2
9.0
40.6
42.6
15.1
14.4
38.7
35.1
12.3
11.6
0.7
0.6
Surya Roshni
Neutral
186
-
814
3,342
3,625
7.8
7.5
17.3
19.8
10.8
9.4
20.4
16.4
10.5
10.8
0.5
0.5
Team Lease Serv.
Neutral
910
-
1,556
3,229
4,001
1.5
1.8
22.8
32.8
40.0
27.7
4.3
3.7
10.7
13.4
0.4
0.3
The Byke Hospitality
Neutral
173
-
693
287
384
20.5
20.5
7.6
10.7
22.8
16.2
4.8
3.8
20.7
23.5
2.4
1.8
Transport Corporation of
Neutral
211
-
1,614
2,671
2,911
8.5
8.8
13.9
15.7
15.2
13.5
2.1
1.9
13.7
13.8
0.7
0.7
India
TVS Srichakra
Neutral
3,013
-
2,307
2,304
2,614
13.7
13.8
231.1
266.6
13.0
11.3
338.5
266.6
33.9
29.3
1.0
0.9
Stock Watch
March 08, 2017
Company Name
Reco
CMP
Target Mkt Cap
Sales ( Čcr )
OPM(%)
EPS (Č)
PER(x)
P/BV(x)
RoE(%)
EV/Sales(x)
(Č)
Price ( Č)
( Č cr )
FY17E FY18E FY17E FY18E FY17E FY18E FY17E FY18E FY17E FY18E FY17E FY18E FY17E FY18E
zOthers
UFO Moviez
Neutral
396
-
1,094
619
685
33.2
33.4
30.0
34.9
13.2
11.4
1.8
1.6
13.8
13.9
1.5
1.2
Visaka Industries
Neutral
234
-
371
1,051
1,138
10.3
10.4
21.0
23.1
11.1
10.1
30.0
28.1
9.0
9.2
0.6
0.6
VRL Logistics
Neutral
291
-
2,652
1,902
2,119
16.7
16.6
14.6
16.8
20.0
17.3
4.4
3.8
21.9
22.2
1.5
1.3
Wonderla Holidays
Neutral
381
-
2,154
287
355
38.0
40.0
11.3
14.2
33.7
26.9
4.8
4.2
21.4
23.9
7.2
5.8
Source: Company, Angel Research; Note: *December year end; #September year end; &October year end; Price as on March 07, 2017
Market Outlook
March 08, 2017
Research Team Tel: 022 - 39357800
DISCLAIMER
Angel Broking Private Limited (hereinafter referred to as “Angel”) is a registered Member of National Stock Exchange of India
Limited,Bombay Stock Exchange Limited and Metropolitan Stock Exchange Limited. It is also registered as a Depository Participant with
CDSL and Portfolio Manager with SEBI. It also has registration with AMFI as a Mutual Fund Distributor. Angel Broking Private Limited is a
registered entity with SEBI for Research Analyst in terms of SEBI (Research Analyst) Regulations, 2014 vide registration number
INH000000164. Angel or its associates has not been debarred/ suspended by SEBI or any other regulatory authority for accessing
/dealing in securities Market. Angel or its associates/analyst has not received any compensation / managed or
co-managed public offering of securities of the company covered by Analyst during the past twelve months.
This document is solely for the personal information of the recipient, and must not be singularly used as the basis of any investment
decision. Nothing in this document should be construed as investment or financial advice. Each recipient of this document should make
such investigations as they deem necessary to arrive at an independent evaluation of an investment in the securities of the companies
referred to in this document (including the merits and risks involved), and should consult their own advisors to determine the merits and
risks of such an investment.
Reports based on technical and derivative analysis center on studying charts of a stock's price movement, outstanding positions and
trading volume, as opposed to focusing on a company's fundamentals and, as such, may not match with a report on a company's
fundamentals. Investors are advised to refer the Fundamental and Technical Research Reports available on our website to evaluate the
contrary view, if any.
The information in this document has been printed on the basis of publicly available information, internal data and other reliable
sources believed to be true, but we do not represent that it is accurate or complete and it should not be relied on as such, as this
document is for general guidance only. Angel Broking Pvt. Limited or any of its affiliates/ group companies shall not be in any way
responsible for any loss or damage that may arise to any person from any inadvertent error in the information contained in this report.
Angel Broking Pvt. Limited has not independently verified all the information contained within this document. Accordingly, we cannot
testify, nor make any representation or warranty, express or implied, to the accuracy, contents or data contained within this document.
While Angel Broking Pvt. Limited endeavors to update on a reasonable basis the information discussed in this material, there may be
regulatory, compliance, or other reasons that prevent us from doing so.
This document is being supplied to you solely for your information, and its contents, information or data may not be reproduced,
redistributed or passed on, directly or indirectly.
Neither Angel Broking Pvt. Limited, nor its directors, employees or affiliates shall be liable for any loss or damage that may arise from
or in connection with the use of this information.